Translate

Wednesday, May 18, 2016

A teacher mispronouncing a student’s name can have a lasting impact—Why we need to grow our own teachers of color...

For many minority, immigrant and English-language learning students, a mispronounced name can be the first of many slights they experience in the classroom.

This is a truly powerful and important piece on just how basic it should be for teachers to be able to pronounce their students' names correctly.  And I really like that there is this long overdue national campaign called  “My Name, My Identity,” "that places a premium on pronouncing students’ names correctly and valuing diversity." 

I want to address this portion of the article:

If students have teachers who share their cultural backgrounds, they’re more likely to hear their names pronounced correctly. But while the diversity of the nation’s public school student body has exploded in the last few decades, the number of African-American, Latino, and Asian teachers hasn’t kept pace.

I sincerely appreciate the idea put herein of having teachers "expand their cultural limits," as suggested, but we need a research-based method and infrastructure for this.  To this end, I and many others propose that our cities, states, and nation consider and fund Grow Your Own  (GYO) teacher of color initiatives and in so doing, contribute to the development of historically-underserved communities in order to sustain the overall initiative.

Based on peer-reviewed and debated research by Texas A & M Political Scientist Professor Kenneth Meier and colleagues, among youth of color in Texas, there was a strong, positive, and consistent correlation of achievement and whether students had a teacher of their same race/ethnicity.  Diverse educational contexts correlated positively to achievement among Anglos, too. 

To use Dr. Meier's words as expressed to me, "This is an absolute finding." Dr. Meier and colleagues interpret this finding from the lens of representative democracy. Having a critical mass of teachers in school districts is an important component of this, too. All of this may be found in NLERAP’s anthology, GROWING CRITICALLY CONSCIOUS TEACHERS.  Here is the link to it at Teachers College Press.

NLERAP is a decades-old project to which we in the National Latino Education Research and Policy (NLERAP) Project have been dedicated. Our key initiative is our GYO Latin@ teacher initiative and we as scholars, academics, school and district representatives, policy makers and advocates have all learned and grown a lot in the process. In particular, NLERAP underscores the importance of a social justice perspective.

When such GYO teachers are present, children’s rights, cultures, world views, experiences and so on get acknowledged in ways that are constructive, affirming, and complete. Not that this happens all the time, but on average, this is the case.  And Meier and colleagues' findings are backed up by substantial, qualitative research that demonstrates as much. 

Since students' race/ethnicity, language, culture, and difference get better addressed when their teachers not only share, but also share in, their lives, communities, and experiences, then let’s create pathways and incentivize a teacher workforce along this path, growing them from our barrios, neighborhoods, colonias, and communities.  Community-based organizations (CBOs) working in partnership with universities and school districts is the optimal approach.  No need to outsource teaching when it should be organic anyway. Plus, it’s rewarding and personally transformative for all of us to do this work, to boot.

By definition, the lived experiences of U.S. minorities is an imbalance in power that has vast implications for them in a society that is profoundly divided by race and class and where they occupy the short end of the stick on both.

Increasing the representation of teachers that come from the students’ own communities through pathways that we—as community-based organizations (CBOs) working in partnership with universities and school districts—create is an excellent way for our communities to address the imbalance of power that exists in society in at least one important societal realm—education.

Much more to come on this as we move forward as an organization.  Just gave a talk at the University of North Texas Dallas on this.  Heading soon to New Mexico, Arizona, and  later to Minnesota.  It's all good.

Angela Valenzuela, Ph. D., Director, Professor
National Latino Education Research and Policy Project, Inc.
Texas Center for Education Policy
The University of Texas at Austin

__________________________________________________________________________________

A teacher mispronouncing a student’s name can have a lasting impact 

BY  


When people come across Michelle-Thuy Ngoc Duong’s name, they often see a stumbling block bound to trip up their tongues. The 17-year-old sees a bridge, one that spans her parents’ journey from Vietnam to the United States. It’s a bridge connecting the U.S.-born teen to Vietnamese culture, a bridge to understanding.
“My name is where I come from,” Michelle-Thuy Ngoc said. “It’s a reminder of hope.”
A junior at Downtown College Prep Alum Rock High School, a San Jose, California-based charter school, Michelle-Thuy Ngoc (pronounced ‘knock twee’) is among the students backing “My Name, My Identity,” a national campaign that places a premium on pronouncing students’ names correctly and valuing diversity.
The campaign—a partnership between the National Association for Bilingual Education, the Santa Clara, California, County Office of Education, and the California Association for Bilingual Education—focuses on the fact that a name is more than just a name: It’s one of the first things children recognize, one of the first words they learn to say, it’s how the world identifies them.
For students, especially the children of immigrants or those who are English-language learners, a teacher who knows their name and can pronounce it correctly signals respect and marks a critical step in helping them adjust to school.
But for many ELLs, a mispronounced name is often the first of many slights they experience in classrooms; they’re already unlikely to see educators who are like them, teachers who speak their language, or a curriculum that reflects their culture.
“If they’re encountering teachers who are not taking the time to learn their name or don’t validate who they are, it starts to create this wall,” said Rita (‘ree-the’) Kohli, an assistant professor in the graduate school of education at the University of California, Riverside. 
“If they’re encountering teachers who are not taking the time to learn their name or don’t validate who they are, it starts to create this wall.” — Rita Kohli, assistant professor at UC Riverside
It can also hinder academic progress.
A divide already exists between many English learners and immigrant students and their native English speaking peers. Despite a national increase in the overall graduation rate, the dropout rate for foreign-born and immigrant students remains above 30 percent, three times that of U.S.-born white students.
Before transitioning into K-12 administration, Santa Clara County Superintendent Jon Gundry taught middle and high school English as a second language classes for 16 years. Many of his students were newcomer English learners and he made it a priority to learn the proper pronunciation of each student’s name on the first day of class.
“I was their first connection to a new culture, a new country,” Gundry said. “As a teacher, I felt that if I didn’t make an effort to pronounce their name correctly, it showed I didn’t care about who they were.”

Rendered Invisible

Effort is the biggest obstacle to learning how to correctly pronounce a person’s name; teachers have to want to do it, said Jennifer Gonzalez, a former teacher and author of the education blog Cult of Pedagogy. To even suggest that a child’s name is difficult to pronounce is problematic, she said.
“Even the word ‘difficult’ is a pretty loaded word,” Gonzalez said. “It’s only difficult because it’s culturally different.”
As a kindergarten student in 1950s Brooklyn, Carmen Fariña, a native-Spanish speaker, had a teacher who marked her absent every day for weeks because she didn’t raise her hand during roll call. The teacher assumed Fariña was being defiant, but the future New York City schools chancellor never heard her name called; the teacher had repeatedly failed to pronounce it correctly, including rolling the r’s.
“Mispronouncing a student’s name essentially renders that student invisible,” Fariña said during a keynote address at the National Association for Bilingual Education annual conference in March.
Kohli produced a study with Daniel Solórzano, a professor of education and Chicano studies at the University of California, Los Angeles, on microaggressions, the subtle slights that are painfully obvious and hurtful to the person receiving them, but unintended and unnoticed by the person saying them. The work, “Teachers Please Learn Our Names! Racial Microaggressions and the K-12 Classroom,” is littered with stories of students who endured shame, anxiety, or embarrassment, and sometimes a mix of all three, when their names were called in class.
There’s the tale of a Portland, Oregon-area student with a traditional Chinese name who had her name garbled by a vice principal during an honors ceremony. Set to present the student with an award, the principal laughed at his mistake, drawing chuckles from the audience.
To avoid embarrassment, the student slumped in her seat, refusing to rise to receive the prestigious award. She later skipped her graduation.
The mispronunciation wasn’t an isolated event. Having endured years of slights, she felt the need to become invisible long before the principal’s laughter marked the tipping point.
The woman, who went on to become an educator, changed her first name to ‘Anita.’
“If someone mispronounces your name once as a high school student, you might correct them,” said Kohli, whose parents immigrated to the United States from India. “But if this has been your entire existence in education, what do you do?”
Kohli’s own brother had a teacher mispronounce his traditional South Asian name, Sharad (‘shu-rudth’) as Sharub during a ninth grade class. The teacher and the students decided it was easier to call him Shrub, and it stuck for the rest of high school. The nickname forced him to check part of his identity at the door.
Michelle-Thuy Ngoc didn’t always embrace her full name, figuring that it would make other people uncomfortable. For years, she ignored the Vietnamese half of her first name, simply going by Michelle. The order in which Vietnamese names are spoken differs from English.
“I came to accept [my full name] over time,” she said.

Building Bridges

If students have teachers who share their cultural backgrounds, they’re more likely to hear their names pronounced correctly. But while the diversity of the nation’s public school student body has exploded in the last few decades, the number of African-American, Latino, and Asian teachers hasn’t kept pace.
Gonzalez, a former teacher in school districts in Kentucky and Maryland, said she often observed a ‘these people’ attitude from her mostly white female colleagues.
“They approached it like, ‘It’s your fault for having a weird name,'” Gonzalez said.
To some degree, Gonzalez understands the struggle students face. She grew up with a Russian surname, Yurkosky, that befuddled teachers and classmates. She said it rhymes with “her-pots-ski,” minus the “t” sound in pots.
“But I did not experience all the other stuff and other ways that a person can feel discriminated against,” said Gonzalez, who is white.
Kohli, a former Oakland Unified School District teacher, recommends that K-12 educators identify and expand their cultural limits and recognize the influence they wield over a student’s sense of self. While frustration or confusion may seem like a natural response when a teacher faces an unfamiliar name, it can leave a “lasting impact on the way that child sees themselves and their culture,” the study’s authors argue.
Butchered names are not just a problem for English learners and immigrants; students from a number of cultural backgrounds have their names garbled or ridiculed. Hawaiian and African-American students, with names that link to their ancestry, also shared stories of how constant mispronunciations made them feel uncomfortable with their names.

Mocking Names?

In an extreme case, a teacher in Wayne Township, New Jersey, lost her tenure status and job in 2015 for mocking a student’s name on Facebook. Several letters in the student’s name spelled out a profane word, legal documents show.
More often, the mocking is more direct and reflexive: laughing off pronunciation, asking the student to take on a nickname, or making a spectacle of their name, Kohli said.
“It matters what you do when you’re in front of a child and struggling with their name,” Kohli said. “Is it framed as my inability to say someone’s name or is it framed as the student doing something to make your life more difficult?”
Michelle-Thuy Ngoc attends Downtown College Prep, a 210-student high school that primarily serves first-generation, low-income Latino students.
“We’re taking the time to understand each person’s story,” said assistant principal Moises Buhain. “It’s as simple as starting with a name.”
As part of a social media campaign, the “My Name, My Identity” initiative is seeking name stories with the #mynamemyid hashtag. The push is personal for Yee Wan, the national association’s president and the director of multilingual education services for the Santa Clara County, California, office of education.
Wan came to the United States as an adolescent English learner, and almost immediately faced pressure from instructors to adopt an “American name” to replace her given name, which means “warm friendship” in Cantonese.
Gundry and Wan developed “My Name My Identity” after hearing a principal share a story about his effort to build connections with English-language learners in school, then feeling the push fall flat when he mispronounced the students’ names at graduation.
“As educators, we have the power to bring awareness to valuing diversity … so that all of our students will feel included,” Wan said.

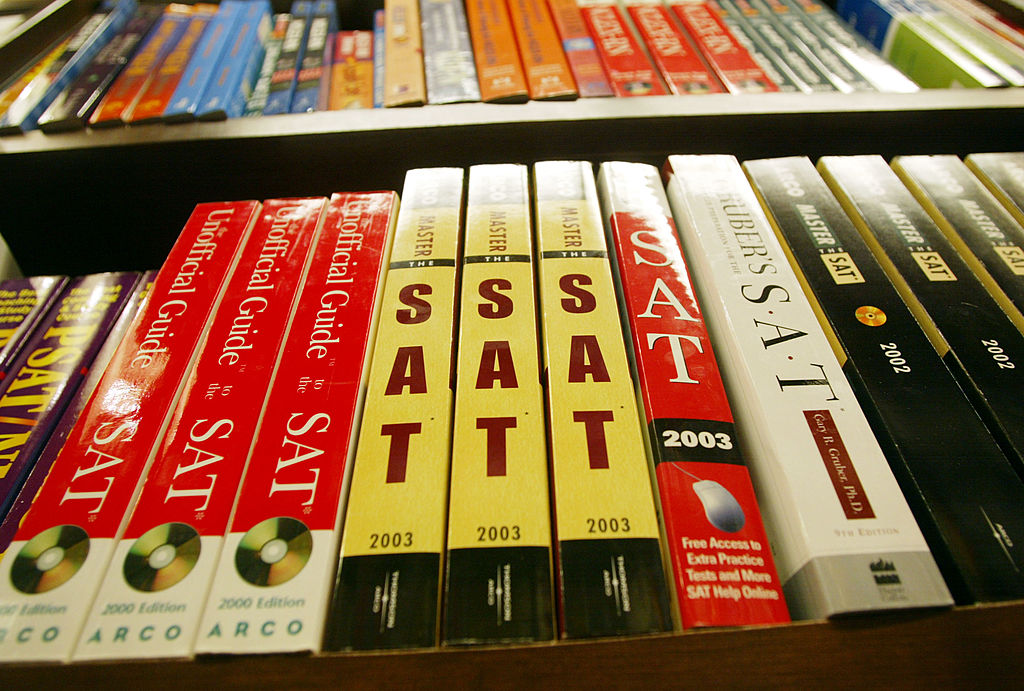
850+ Colleges and Universities That Do Not Use SAT/ACT Scores to Admit Substantial Numbers of Students Into Bachelor Degree Programs

I applaud the National Center for Fair and Open Testing—better known as"FairTest," that also has a board on which I am honored to sit.  I refer specifically to Monty Neil, Bob Schaeffer, Lisa Guisbond, and David Mirabella. Literally for decades, they have selflessly, intelligently, courageously, and passionately led against the injustices of test abuse and high-stakes testing.

Decades ago when I was a 20-something graduate student at Stanford University, I remember coming across this organization in their campaign against the SAT and ACT.  That's how I first got to know them and now I am on the FairTest Board.  As you can see from this piece, the struggle not only continues but we have continued to make strides.

Hats of to my heroes at FairTest and to our awesome board for fighting the good fight for all these years.  FYI, here's our board:

FAIRTEST BOARD OF DIRECTORS

Dr. Sophie Sa, Chair; Founding Executive Director (retired), Panasonic Foundation, Secaucus, NJ

Judith Browne-Dianis, Esq., Vice-Chair; Co-Director, Advancement Project, Washington, DC.

Laura Barrett, Clerk; Communications Specialist, Massachusetts Teachers Association, Boston, MA;

Dr. Mary Lu Bilek; Dean and Professor of Law, University ofMassachusetts School of Law, Dartmouth, MA

Ann Cook; Executive Director, NY Standards Performance Consortium, New York, NY

Nikhil Goyal; Author and activist; Woodbury, NY

Dr. Ellen Condliffe Lagemann; Levy Institute Research Professor, Bard College, and Distinguished Fellow, Bard Prison Initiative, Annandale-on-Hudson, NY

Deborah Meier; Founding principal, Central Park East (NYC) and Mission Hill (Boston) schools, Hillsdale, NY; Professor, New York University

Linda Nathan; special assistant to superintendent, Boston Public Schools; formerly Founding Headmaster, Boston Arts Academy; Cambridge, MA

George Rosenfeld; History Professor, Bard Prison Initiative,New York, NY

Robert Schaeffer; President, Public Policy Communications, Sanibel, FL

Angela Valenzuela; Professor, U. Texas-Austin, and Director,Texas Center for Education Policy; Austin, TX

-Angela Valenzuela

850+ Colleges and Universities That Do Not Use SAT/ACT Scores to Admit Substantial Numbers of Students Into Bachelor Degree Programs

Current as of Spring 2016

FairTest counts on the support of individuals like you!

Please Donate NOW So We Can Keep this List Up-to-Date

This list includes institutions that are "test optional," "test flexible" or otherwise de-emphasize the use of standardized tests by making admissions decisions about substantial numbers of applicants who recently graduated from U.S. high schools without using the SAT or ACT.
As the notes indicate, some schools exempt students who meet grade-point average or class rank criteria while others require SAT or ACT scores but use them only for placement purposes or to conduct research studies. Please check with the school's admissions office to learn more about specific admissions requirements, particularly for international or non-traditional students.
Sources: Barron's Profiles of American Colleges 2015; College Board 2016 College Handbook; U.S. News & World Report College Guide 2016; admissions office websites; news reports; and email communications
Note: Schools with live links to their websites and admissions offices have paid a modest fee for this service. Linking does not imply any form of endorsement. If your institution would like to participate in the live link program, please contact FairTest at (617) 477-9792 or by clicking CONTACT US above.
The List is organized alphabetically by school - if you click the word state at the top it will re-sort itself by state.
For a print formated hard copy PDF file of this list click here.
Also Available as PDF:

The Decolorization of Booker T. Washington High School for the Performing & Visual Arts

Powerful read.  Race and class matter. This is a story about a lost legacy, to the detriment of artistic African American and Latino youth of color with enormous potential in Dallas, Texas.  In a more perfect world, white, middle class privilege would be non-existent and the arts would be widely accessible to all—not as a privilege, but as a right and talent that gets recognized and developed in youth and in our communities.

-Angela


The Decolorization of Booker T. Washington High School for the Performing & Visual Arts: Is anyone else but me noticing the loss of “color”, particularly black color in both the student body and faculty at the city’s premier arts high school? Given that this is a public high school that once served as a desegregation model for DISD, it’s especially alarming at how “whitewashed” the school’s become. I have a long history with this school having taught there, had two children graduate from there and served on both the Advisory Board and the BTWHSPVA Arts Council. When I first joined the faculty in visual arts in the early 90s, the school was still under the desegregation order so the racial ratios were mandated by that order. It was roughly 30/30/30, which represented the three major racial groups at the time(Black, White and Latino). By the time my daughter graduated in 2004, that number had shifted to having a few less Black and Latino students and a few more White students. Once the desegregation order was lifted, the ratios began to shift again, this time with the numbers beginning to shift heavily in favor of increased white student enrollment.

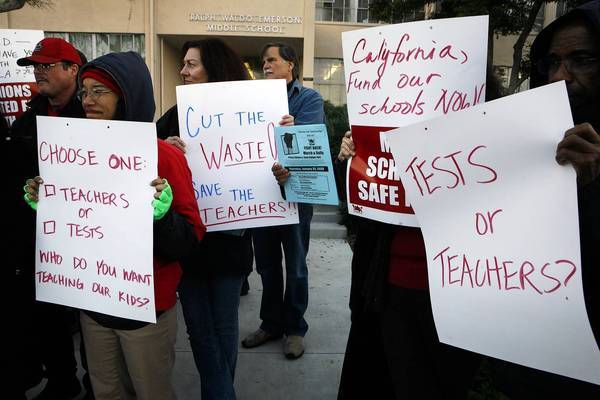
MORE THAN 675,000 STUDENTS REFUSED STATE TESTS ACROSS U.S. IN 2015; EVEN BROADER PROTESTS PLANNED FOR SPRING 2016 EXAM SEASON GROWING OPT-OUT MOVEMENT SPURS ASSESSMENT REFORMS

The Opt-Out Movement is also happening in Texas—and has in fact been happening here since the beginning of all this testing madness.  This blog was motivated into existence in great part by this initially small movement that is today (finally!) a full-blown, national campaign.

I shudder to think of all the damage that we have done to children as a consequence of the mis-education that has occurred as a result of the de facto curriculum that the tests themselves represent in many schools—even as they work as a conduit for the direct flow of taxpayer dollars into the pockets of the greedy, for-profit sector that further translates the whole of education into the (il)logic of the market.  Schools aren't a business, my friends.  They are a public space that troubles itself over values, ethics, and morality alongside the development of human, social, and cultural capital.

Angela

Updated Monday, May 9, 2016

MORE THAN 675,000 STUDENTS REFUSED STATE TESTS ACROSS U.S. IN 2015; EVEN BROADER PROTESTS PLANNED FOR SPRING 2016 EXAM SEASON GROWING OPT-OUT MOVEMENT SPURS ASSESSMENT REFORMS


     Around the U.S., more than two-thirds of a million public school students refused to take standardized exams during the 2015 testing season, according to a preliminary tally released today. The count by the National Center for Fair & Open Testing (FairTest), a leader of the national assessment reform movement, is based on news reports and detailed surveys by local activists.
Among the largest state opt-out figures (with sources):

-  240,000   New York (news reports and New York State Allies for Public Education counts)
-  130,000   New Jersey (NJ Spotlight)
-  100,000   Colorado (Chalkbeat Colorado and SEEK for Cherry Creek)
-    50,000+ Washington State (news reports)
-    44,000   Illinois (Chicago Tribune from state report)
-    20,386   California (EdSource)
-  ~20,000   Oregon (news reports)
-    20,000   Florida (Orlando Sentinel from state report)
-    11,200   Connecticut (news reports)
-    10,300   Rhode Island (state report)
-    10,000   New Mexico (news reports)
-      8,100   Wisconsin (Wisconsin State Journal from state reports)
-    ~5,000   Louisiana (Baton Rouge Advocate from state report)
-      4,600   Pennsylvania (Lehigh Valley Live from state report)
-      4,300   Georgia (Atlanta Journal Constitution from state official)
-       ?  ?     Other states not yet reporting

“The opt-out movement and other assessment reform initiatives exploded across the country this year as more parents said ‘enough is enough’ to high-stakes testing overkill,” explained FairTest Executive Director Monty Neill. “If anything, the initial estimate of half a million opt-outs in 2015 was low because many states have denied requests to make test refusal data public. This intense grassroots pressure is beginning to force policymakers to roll back standardized exam misuse and overuse.”

FairTest Public Education Director Bob Schaeffer concluded, “The assessment reform movement is energizing ever-growing legions of parents, students, educators, school administrators, and community leaders. In the 2016 testing season, we expect many more families to refuse to take part in unnecessary testing, which undermines educational quality and equity.”
- - 3 0 - -

- for details about local assessment reform campaigns:
            New York -- Lisa Rudley 917-914-9190 or Jeanette Deutermann 516-902-9228
            New Jersey -- Susan Cauldwell 908-507-1020 or Julie Borst 201-693-3808
            Colorado -- Ilana Spiegel  303-523-0711 or Stefanie Fuhr 303-483-1196
            Washington State -- Jesse Hagopian 206-962-1685
            Illinois  -- Cassie Creswell 716-536-9313
- to reach assessment reform organizers in other jurisdictions, see the state-by-state list of contacts at:
                                       http://www.fairtest.org/get_involved/state_resources

- FairTest’s recent report “Testing Reform Victories 2015: Growing Grassroots Movement Rolls Back Testing Overkill” is online at: http://www.fairtest.org/sites/default/files/2015-Resistance-Wins-Report-Final.pdf

Tuesday, May 17, 2016

The 66 Percent: Erasing Mexican Americans in the United States

-->
Digestion or In Digestion? Which shall it be?
 
This excellent piece by renowned author Dagoberto Gilb reminds me of something that the late Dr. George I. Sanchez wrote about in a piece of his on bilingual education that I read (1940s publication, as I recall) which expressed that Mexican Americans are not "digestible" by the dominant, Anglo society—or that Anglos suffer from "cultural indigestion" with respect to the Mexican American.  As this piece conveys, this is certainly how it is frequently felt and experienced by our communities.  In my own work, I refer to this as subtractive cultural assimilation (popularly known as just "assimilation") or in schooling contexts, as "subtractive schooling."


A good study would be to see how these politics of erasure differ, if at all, among the progeny of mixed marriages.  After all, there is a lot of mixing, too, and likely not without consequence—in a positive direction, I would hope—or at least, mostly so with respect to attitudes and intercultural relations.  
Minimally, ease and comfort in digestion. :-)


-Angela

The 66 Percent: Erasing Mexican Americans in the United States

by Dagoberto Gilb

TEXAS OBSERVER


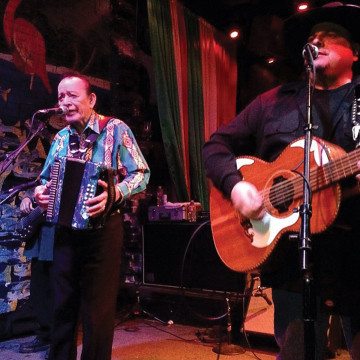
Flaco Jimenez and Max Baca on stage at Flamingo Cantina, Austin, in December 2013.
Flickr/Robotclaw Photo
Flaco Jimenez and Max Baca on stage at Flamingo Cantina, Austin, in December 2013.
If you’re from Texas, or the American Southwest for that matter, and a fan of its music, your ears surely perked up when the popular National Public Radio program Fresh Air focused an episode on the accordion. Many would say that the “squeeze box” is the region’s sound, and thus its most original contribution to America’s musical heritage. Yet that’s not what Fresh Air’s host had heard or knew anything about. Instead, she’d thought the instrument was about as exciting as the 1950s TV show with Lawrence Welk — which was for an already dated, slow waltz crowd in the years it was being produced. She considered accordions, therefore, corny and annoying, valuable only, maybe, for bar mitzvahs. But times changed, her ears were re-tuned, and with her show’s guest, we were to learn that the accordion was a surprisingly not dull instrument, loved in Cajun, avant garde, folk, indie pop, even something called klezmer, and that its sound’s reach was not just Eastern Europe, but Argentina, Madagascar and especially in a new French Musette “explosion.”
Out in the boonies of America’s West, where these national shows are well-heard, there lives a loud, boisterous tradition of music that dates from the turn of the last century that goes by the name “conjunto.” It is true that it belongs to a native people of the West, a peoples whose history can be traced back at least two centuries to what is American soil — born and raised within the geographical and historical boundaries of the United States — and this music, which at its big stage center is the accordion, has been its magnetic draw. Not only in the legendary sound of South Texas’s Narciso Martínez, or San Antonio’s Don Santiago Jiménez, but especially through his two sons, Santiago Jr., and Leonardo, better known as “skinny”: Flaco Jiménez’s fame, in particular, is so grand and wide that in 2015 he received a Lifetime Achievement Grammy Award for his accordion virtuosity and preeminence. And it was the Mexican American music — not South American, African, or European — that didn’t get a mention on Fresh Air’s one-hour episode.

Really there is nothing surprising or new about most of the country being unaware of the culture and community of MexAmerica. On the other hand, it is such a strange form of ignorance — let me hyphenate to adjust the connotation, make it ignore-ance — that one might want to call it utterly fascinating in that unique quality. It requires omitting consciousness that so much of the western landmass of continental United States has rivers, valleys, mountain ranges, states, cities, streets and people with Spanish-language names. Over the years (and by years I mean at least 50) historians and scholars are inclined to attribute that unawareness to an “invisibility” of the community.


But the implication of this becomes that it must be something of a quaint, natural character inside the MexAm people, and not the effect of poverty or consequence of a lack of political power. I’d suggest that it’s more a visual degeneration in the center of the dominant culture’s eyes. No faces, only hands serving enchilada plates and then busing away what’s left of the spicy yum yum. Beds are made after a fun vacation day, floors swept and waxed for the bright, bustling morning in the office, lawns mowed and edged, healthy veggies are in the grocery store: People are not seen, neighborhoods go unknown, songs unheard, deaths not mourned… no cries of birth, sighs of first love, screams of sports joy; no bandages for knees, catechisms for church, homework for teacher, pink socks or baseballs or first cars or skateboards or bad boyfriends or off to war or diplomas or retirement dinners or college or family potlucks or ’buelita turned 99. And though I believe most of the ignorance about MexAms is not conscious or willful, it is equally true that enough is, be it forced by racist politicians in Arizona, or an ongoing blow of American history that began with President James K. Polk’s want of the land by any means necessary.

Even now, too many media stories that do attach are about immigration from the border, inferring that the entire community is recent and, worse, invasive — which, ironically, would be more appropriately descriptive of the Anglo migration from the South in Texas and the Midwest in California. More ironic — bizarre? — is how much it loves, besides the food, everything about the region’s Mexican culture, art and architecture, yet is shocked that these “other” people live here. “Invisible” is not the best word, that is certain. The culture is everywhere, is highly accepted, as mainstream American as the taco has become. But just as the Spanish rejected the corn tortilla of the conquered indios, the essence of the MexAm culture is regarded as too “lesser” to be taken seriously.

Accustomed as its own nation is to treating Mexican Americans as negligible or dismissible, times are changing as demographics do. It is said that this century will be about the power of the Latino. Latino? Take away the 66 percent of this population, the MexAm proportion, that one so hidden away in its western homeland, and what national power then? With the other third divided into several single percentage groups, MexAms ought to receive a landslide of attention. Yet, already and again, the raw facts haven’t created any gain, let alone advantage. Money and political pull are on the East Coast, and the national media’s stories are about those who are there; Puerto Ricans, Cubans and Dominicans are more the voice of The Latino, following the last century’s big city paradigm of Italian, Irish and Jewish immigrants. MexAms don’t fly from New York to Mexico City, Los Angeles to Chihuahua. Instead, they are home in a poor city like El Paso or Ysleta or Eagle Pass, McAllen, San Antonio, Santa Ana, Riverside, Fresno, Chula Vista, Tucson, Nogales, Albuquerque, Denver, or Boyle Heights, El Monte, La Puente, Lynwood, South Gate. Though everybody’s house has family allá, most have never been farther across — across, meaning the “other side,” Mexico — than Matamoros, Juárez or Tijuana to look for cheaper prescription drugs or dentistry.

And so it goes with literature. The “national” scene knows the very least about Mexican American literature, historically or currently. Though it may not always be as clear as an Arizona school board banning material for ambitious, college-bound young Mexican American students who notice their culture’s absence in their curriculum, the offense, sadly, is the same, only larger in scale, when written voices and stories are passively ignored by all school districts, even when their student body is predominantly of Mexican American descent. Or even more: Why aren’t we going past wanting to educate MexAm children, in their own neighborhoods, to have ordinary pride in who they are and where they’ve come from, and asking how long all of our country can ignore a huge American region and heritage? How can it not want to understand or appreciate its people beyond enchilada or child-care talents, but as craftsmen, business owners, artisans and artists, thinkers, as purposeful voters, as the country’s future leaders? Too much to say as friends? As those who work alongside so many and have children who are in the same classes as their own? Is it possible to ignore and dismiss, to undervalue, an entire people without consequence? How should we educate all our own to each other?

[This essay is adapted from the recently published Mexican American Literature: A Portable Anthology. The featured image is via Flaco Jimenez/Facebook.
]

Sunday, May 15, 2016

From Selectivity to Success: Latinos at Selective Institutions

This merits a close read.  The short of it is that we need more Latin@ and other underrepresented minority students of color at our nation's most selective institutions. Resources are available here.
-Angela


The most selective institutions of higher education are recognized by their competitive admissions, low admittance rates, high cost to attend, and the prestige garnered from achievements of their alumni. Hispanics’ graduation rates at the most selective institutions of higher education are higher than at less selective institutions. Yet, only 12 percent of Latinos are enrolled at these institutions. At a time when more attention is given to the benefits of attending a selective institution and these institutions look to increase the diversity of their student body, it is critical to look at how they contribute to Latino student success. - See more at: http://www.edexcelencia.org/research/selectivity#sthash.LPpIezhx.dpuf


he most selective institutions of higher education are recognized by their competitive admissions, low admittance rates, high cost to attend, and the prestige garnered from achievements of their alumni. Hispanics’ graduation rates at the most selective institutions of higher education are higher than at less selective institutions. Yet, only 12 percent of Latinos are enrolled at these institutions. At a time when more attention is given to the benefits of attending a selective institution and these institutions look to increase the diversity of their student body, it is critical to look at how they contribute to Latino student success.
 
From Selectivity to Success: Latinos at Selective Institutions examines the profile of Latino students at the most selective institutions and reviews the institutional efforts at four universities in California to frame a better understanding of factors that might explicitly and intentionally support Latino student success. The research and analysis for this brief were supported by the Gilbert & Jacki Cisneros Foundation.
 
DOWNLOAD REPORT AND INFOGRAPHIC JPG AND PDF BELOW
- See more at: http://www.edexcelencia.org/research/selectivity#sthash.LPpIezhx.dpuf
he most selective institutions of higher education are recognized by their competitive admissions, low admittance rates, high cost to attend, and the prestige garnered from achievements of their alumni. Hispanics’ graduation rates at the most selective institutions of higher education are higher than at less selective institutions. Yet, only 12 percent of Latinos are enrolled at these institutions. At a time when more attention is given to the benefits of attending a selective institution and these institutions look to increase the diversity of their student body, it is critical to look at how they contribute to Latino student success.
 
From Selectivity to Success: Latinos at Selective Institutions examines the profile of Latino students at the most selective institutions and reviews the institutional efforts at four universities in California to frame a better understanding of factors that might explicitly and intentionally support Latino student success. The research and analysis for this brief were supported by the Gilbert & Jacki Cisneros Foundation.
 
DOWNLOAD REPORT AND INFOGRAPHIC JPG AND PDF BELOW
- See more at: http://www.edexcelencia.org/research/selectivity#sthash.LPpIezhx.dpuf

Saturday, May 14, 2016

50% of 26 Million Latinos Eligible to Vote are Not Registered to Vote

-->
This is from a respectable, subscription-only blog, THE VOICE OF THE MAINLAND WHERE "THE EDITOR" provides the following update for the Latino Civil Rights Community.  This should concern us greatly.  Folks need to get active in their communities, conduct registration drives.  Great advice provided herein in how to go about this.  The numbers bleed off the page, but hopefully, you can still decipher these. 

In short, "We have 136 days to register 12,454,298 Latinos."

-Angela


 50% of 26 Million Latinos Eligible to Vote are Not Registered to Vote


The Editor: There are approximately 6 months until election day and we are going to be confronted with difficult times if we do not vote.  I have been conducting my statistical research about how Latinos vote.  The story line in most political media is that we do not vote, that is, Latinos do not vote.  The truth is that we do vote, if we are registered to vote.  Our turnout rate is on par with the rest of America on voting.  Our problem is that 1/2 of the Latino eligible voting population is not registered to vote.  In numbers, of the 25,416,934 Latinos who are US Citizens, who are 18 and over years of age and are eligible to vote, only 12,962,636 are registered to vote and 12,454,298 are not registered to vote.  The voter turnout rate for the US since 1960 runs as follows:

1960 62.77% 1976 53.55% 1992 55.24% 2008 58.23%
1964 61.92% 1980 52.56% 1996 49.00% 2012 54.87%
1968 60.84% 1984 53.27% 2000 51.21%

1972 55.21% 1988 50.15% 2004 56.70%


Projection for voter turnout for 2016 should be along the lines of 2008 and 2012.  If it is historic, the turnout could be as high as the '60 turnout of 62.77%.

The Latino vote is projected to have a significant impact in the 2016 general election.  The impact is significant when the difference in the winning vote is small.  Latinos could double the impact by registering the 12.5 million Latinos who are not registered to vote.  Doubling the Latino voting pool could have a definite impact in states like Nevada, Colorado and Arizona and if done to the hilt could even turn a state like Texas BLUE 2,360,820 are not registered to vote in Texas.  Wendy Davis lost Texas by 960,951 votes.  Another 2.36 million Latinos in the "voter bank" would have elected Wendy Davis, in spite of the 30% Texas Latino who voted against Davis.

Getting Latinos to vote is not the problem.  Get them registered and they will turn out to vote.  Latinos do not have to be told who to vote for.  Get them registered to vote and they will know how to vote.  We have 136 days to register 12,454,298 Latinos.
To conduct a registration drive, I would advice you to carve out the area by city block or by voting precinct designation and drive them to the registration office.  Do not try to get voter registration lists.  They are usually incomplete, that is, they will be telling you 1/2 the story, since we know from starters that 50% of Latinos are not registered to vote.  Don't try to become a registrar.  It's too messy, too complicated and too crazy.  Take them to the registrar's office and be their register advocate.  Registering voters is a house by house project.  You have to knock on the door when people are home from work.  Your first task is to figure out how many in the house are eligible to vote, US Citizen, 18 and over.  Next assess who is registered and who is not registered.  As you identify unregistered qualified to vote, but not registered, offer them assistance to get them registered.  Make sure they have photo identifications and if they don't, assist them in getting a photo ID from the agencies who handle driver's licenses in the state.  Assist them in going to the registrar's office prepared.
I have prepared a listing of Latino eligible voters by state.  Check out you state.  Our goal should be to get 12,454,298 Latinos registered to vote.  Let's help keep America BLUEThe Editor is asking the Dreamers to get involved in this project.  There are 713,000 DACA participants.  This is a good project for DACA.  Obviously, it is also a good project for all Latinos.
State Total Population Eligible Voter Pop Latino Pop Latino Eligible Voter Pop Hispanics Who Are Eligible to Vote Who Are Registered Hispanics Who Are Eligible to Vote Who Are Not Registered Share Latino among Total Pop Share Latino among Eligible Voters Share of Latino pop eligible to vote
AL 4,850,000 3,647,000 193,000 66,000 33,660 32,340 4.00% 1.80% 34.20%
AK 737,000 529,000 49,000 29,000 14,790 14,210 6.60% 5.50% 59.20%
AZ 6,730,000 4,595,000 2,057,000 986,000 502,860 483,140 30.60% 21.50% 47.90%
AR 2,966,000 2,171,000 205,000 60,000 30,600 29,400 6.90% 2.80% 29.30%
CA 38,801,000 24,663,000 14,987,000 6,910,000 3,524,100 3,385,900 38.60% 28.00% 46.10%
CO 5,356,000 3,811,000 1,135,000 551,000 281,010 269,990 21.20% 14.50% 48.50%
CT 3,596,000 2,590,000 541,000 284,000 144,840 139,160 15.00% 11.00% 52.50%
DL 936,000 694,000 83,000 40,000 20,400 19,600 8.90% 5.80% 48.20%
DC 659,000 493,000 68,000 27,000 13,770 13,230 10.30% 5.50% 39.70%
FL 19,894,000 14,159,000 4,787,000 2,566,000 1,308,660 1,257,340 24.10% 18.10% 53.60%
GA 10,097,000 7,068,000 922,000 288,000 146,880 141,120 9.10% 4.10% 31.20%
HI 1,420,000 1,016,000 144,000 85,000 43,350 41,650 10.10% 8.40% 59.00%
ID 1,634,000 1,148,000 197,000 82,000 41,820 40,180 12.10% 7.10% 41.60%
IL 12,883,000 9,051,000 2,151,000 932,000 475,320 456,680 16.70% 10.30% 43.30%
IN 6,596,000 4,838,000 428,000 170,000 86,700 83,300 6.50% 3.50% 39.70%
IA 3,108,000 2,295,000 172,000 65,000 33,150 31,850 5.50% 2.80% 37.80%
KS 2,903,000 2,067,000 328,000 129,000 65,790 63,210 11.30% 6.20% 39.30%
KY 4,414,000 3,309,000 145,000 46,000 23,460 22,540 3.30% 1.40% 31.70%
LO 4,651,000 3,428,000 223,000 95,000 48,450 46,550 4.80% 2.80% 42.60%
ME 1,330,000 1,052,000 20,000 12,000 6,120 5,880 1.50% 1.10% 60.00%
MD 5,975,000 4,214,000 557,000 193,000 98,430 94,570 9.30% 4.60% 34.60%
MA 6,745,000 4,892,000 729,000 373,000 190,230 182,770 10.80% 7.60% 51.20%
MI 9,909,000 7,414,000 477,000 224,000 114,240 109,760 4.80% 3.00% 47.00%
MN 5,459,000 3,987,000 277,000 95,000 48,450 46,550 5.10% 2.40% 34.30%
MS 2,994,000 2,223,000 81,000 30,000 15,300 14,700 2.70% 1.30% 37.00%
MO 6,063,000 4,558,000 233,000 104,000 53,040 50,960 3.80% 2.30% 44.60%
MT 1,024,000 788,000 35,000 19,000 9,690 9,310 3.40% 2.40% 54.30%
NE 1,881,000 1,343,000 190,000 67,000 34,170 32,830 10.10% 5.00% 35.30%
NV 2,839,000 1,895,000 790,000 325,000 165,750 159,250 27.80% 17.20% 41.10%
NH 1,327,000 1,027,000 43,000 22,000 11,220 10,780 3.20% 2.10% 51.20%
NJ 8,938,000 6,104,000 1,729,000 824,000 420,240 403,760 19.30% 13.50% 47.70%
NM 2,085,000 1,467,000 994,000 596,000 303,960 292,040 47.70% 40.60% 60.00%
NY 19,745,000 13,626,000 3,671,000 1,871,000 954,210 916,790 18.60% 13.70% 51.00%
NC 9,944,000 7,203,000 890,000 250,000 127,500 122,500 9.00% 3.50% 28.10%
ND 739,000 559,000 21,000 11,000 5,610 5,390 2.80% 2.00% 52.40%
OH 11,595,000 8,743,000 399,522 200,934 102,476 98,458 3.40% 2.30% 50.30%
OK 3,878,000 2,788,000 378,000 135,000 68,850 66,150 9.70% 4.80% 35.70%
OR 3,970,000 2,899,000 498,000 184,000 93,840 90,160 12.50% 6.30% 36.90%
PA 12,788,000 9,725,000 836,000 431,000 219,810 211,190 6.50% 4.40% 51.60%
RI 1,055,000 779,000 148,000 66,000 33,660 32,340 14.00% 8.50% 44.60%
SC 4,833,000 3,620,000 257,000 87,000 44,370 42,630 5.30% 2.40% 33.90%
SD 853,000 632,000 29,000 15,000 7,650 7,350 3.40% 2.40% 51.70%
TN 6,547,000 4,873,000 322,000 91,000 46,410 44,590 4.90% 1.90% 28.30%
TX 26,956,000 17,158,000 10,409,000 4,818,000 2,457,180 2,360,820 38.60% 28.10% 46.30%
UT 2,943,000 1,897,000 397,000 145,000 73,950 71,050 13.50% 7.60% 36.50%
VT 627,000 493,000 11,000 7,000 3,570 3,430 1.80% 1.40% 63.60%
VA 8,324,000 6,003,000 733,000 283,000 144,330 138,670 8.80% 4.70% 38.60%
WA 7,061,000 4,999,000 857,000 334,000 170,340 163,660 12.10% 6.70% 39.00%
WI 7,609,000 5,772,000 396,000 164,000 83,640 80,360 5.20% 2.80% 41.40%
WY 584,000 432,000 57,000 29,000 14,790 14,210 9.80% 6.70% 50.90%

318,851,000 224,737,000 55,279,522 25,416,934 12,962,636 12,454,298 17.30% 11.30% 46.00%

Posted by Editor