Translate

Showing posts with label national report. Show all posts

Friday, October 26, 2018

Texas' Tax System Ranked Second in Level of Unfairness Nationwide

Important national report titled, "Who Pays? A Redistributional Analysis of the Tax System in All 50 States," that shows Texas' tax system ranked second in level of unfairness relative to 48 other states nationwide.

This is why we all have to go out and vote and be involved in economic, especially school finance policy and politics.  Let's begin with everybody who is registered to vote, committing to do so right now during the midterms.

It is not until we have folks that genuinely represent us that we will have the equity that we so desperately need.


Thanks to Dick Lavine from CPPP for sharing.
 -Angela

EXECUTIVE SUMMARY

Who Pays: A Distributional Analysis of the Tax Systems in All 50 States (the sixth edition of the report) is the only distributional analysis of tax systems in all 50 states and the District of Columbia. This comprehensive report assesses tax fairness by measuring effective state and local tax rates paid by all income groups.[1] No two state tax systems are the same; this report provides detailed analyses of the features of every state tax code. It includes state-by-state profiles that provide baseline data to help lawmakers and the public understand how current tax policies affect taxpayers at all income levels.
The report includes these main findings:
  • THE VAST MAJORITY OF STATE AND LOCAL TAX SYSTEMS ARE INEQUITABLE AND UPSIDE-DOWN, taking a much greater share of income from low- and middle-income families than from wealthy families. The absence of a graduated personal income tax in many states and an overreliance on consumption taxes contribute to this longstanding problem.
  • THE LOWER ONE’S INCOME, THE HIGHER ONE’S OVERALL EFFECTIVE STATE AND LOCAL TAX RATE. On average, the lowest-income 20 percent of taxpayers face a state and local tax rate more than 50 percent higher than the top 1 percent of households. The nationwide average effective state and local tax rate is 11.4 percent for the lowest-income 20 percent of individuals and families, 9.9 percent for the middle 20 percent, and 7.4 percent for the top 1 percent.
  • TAX STRUCTURES IN 45 STATES EXACERBATE INCOME INEQUALITY. Most state and local tax systems worsen income inequality by making incomes more unequal after collecting state and local taxes. Five states and the District of Columbia somewhat narrow the gap between lower- and middle- income taxpayers and upper-income taxpayers, making income slightly more equitable after collecting state and local taxes.
  • IN THE 10 STATES WITH THE MOST REGRESSIVE TAX STRUCTURES (THE TERRIBLE 10), THE LOWEST-INCOME 20 PERCENT PAY UP TO SIX TIMES AS MUCH OF THEIR INCOME IN TAXES AS THEIR WEALTHY COUNTERPARTS. Washington State is the most regressive, followed by Texas, Florida, South Dakota, Nevada, Tennessee, Pennsylvania, Illinois, Oklahoma, and Wyoming.
  • HEAVY RELIANCE ON SALES AND EXCISE TAXES ARE CHARACTERISTICS OF THE MOST REGRESSIVE STATE TAX SYSTEMS. Six of the 10 most regressive states derive roughly half to two-thirds of their tax revenue from sales and excise taxes, compared to a national average of about one-third. Seven of these states do not levy a broad-based personal income tax while the remaining three have a personal income tax rate structure that is flat or virtually flat. A calculation of effective sales and excise tax rates finds that, on average, the lowest-income 20 percent pays 7.1 percent, the middle 20 percent pays 4.8 percent and the top 1 percent pays a comparatively meager 0.9 percent rate.
  • A PROGRESSIVE GRADUATED INCOME TAX IS A CHARACTERISTIC OF THE LEAST REGRESSIVE STATE TAX SYSTEMS. States with the most equitable state and local tax systems derive, on average, more than one-third of their tax revenue from income taxes, which is above the national average of 27 percent. These states promote progressivity through the structure of their income taxes, including their rates (higher marginal rates for higher-income taxpayers), deductions, exemptions, and use of targeted refundable credits.
  • STATES COMMENDED AS “LOW-TAX” ARE OFTEN HIGH-TAX FOR LOW- AND MIDDLE-INCOME FAMILIES. The 10 states with the highest taxes on the poor are Arizona, Florida, Hawaii, Illinois, Indiana, Iowa, Oklahoma, Pennsylvania, Texas, and Washington. Six of these are also among the “terrible ten” because they are not only high-tax for the poorest, they are also low-tax for their richest residents.

Sunday, February 18, 2018

Perspectives and Reflections From Latino Teachers

Perspectives and Reflections From Latino Teachers

America is experiencing a diverse, cultural shift and the teacher workforce is lagging behind: While Latino students make up 25 percent of the U.S. student population, and that percentage is growing rapidly, just 8 percent of the nation’s teachers identify as Latino. And although greater numbers of Latino teachers are entering the classroom, they, like other teachers of color, are leaving the profession at higher rates than their White peers.

Download the Full Report

Our Stories, Our Struggles, Our Strengths expounds on the challenges of Latino teachers, who are:
  • A diverse group with diverse experiences, and identify by their country of origin, their immigration status, their language, and their race;
  • Often belittled or perceived as aggressive when they incorporated Latino culture or Spanish language in the classroom, especially when advocating for Latino students and parents;
  • Expected to take on additional roles, most often as a translator (even if they did not speak Spanish), but were overlooked for advancement opportunities; and
  • Role models for Latino students especially, but still felt inferior and had to validate their ability to teach.
“While research shows that students from all races benefit from being taught by an educator of color, our study shows that the discrimination and implicit bias that Latino teachers face leave them feeling discouraged and perceived as unqualified to be professional educators, which hurts the teachers and in turn students. By listening to and learning from Latino teachers, school leaders can start to create and implement supports and working environments aimed at increasing the number of Latino teachers and retaining them.”

Listening to Latino Teachers

We spoke with more than 90 Latino teachers in a series of nationally representative focus groups, adding rigorous qualitative data to the ongoing national conversation about teacher diversity. The purpose of these focus groups was to better understand Latino teachers’ experiences separate from the broad category of teachers of color, including why they teach, what they believe they bring to the classroom, and what challenges they face in the workplace.


Every discussion was a continuous reminder that Latino teachers are not a monolith: Their experiences based on cultural, racial, and ethnic backgrounds not only differ from other teachers of color, but also from each other. Yet, despite their differences, they held a common passion for teaching, sharing their culture with all students, and creating empowering spaces and encouraging students to do the same.
To build and maintain a teacher workforce that is representative and capable of serving an increasingly diverse student population, district leaders must pay as much attention to understanding and creating the right conditions to retain Latino teachers as they do to recruiting them.

Why Do Latino Teachers Matter?

Understanding the differences among teachers of color is critical for diversifying the workforce. The Latino men and women educators with whom we spoke represent a multitude of ethnicities, nationalities, and races. They serve as community resources, advocates, role models, and educators, creating empowering and empathic spaces for parents and strengthening educational opportunities for students.

Despite their strengths, however, Latino teachers face discrimination and stereotyping that leave them feeling discouraged and inferior as educators. By examining these dynamic experiences of Latino teachers, all educational stakeholders can begin to develop supports and working environments aimed at increasing the number of Latino teachers in the workforce and, more importantly, retaining them. This is imperative for building a truly diverse workforce capable of serving an increasingly diverse student population.
  •  
  •  

Sunday, September 10, 2017

The GDP produced by Latinos in the U.S. in 2015 was $2.13 trillion

Powerful and empowering information and data.
You can download here. 
Angela

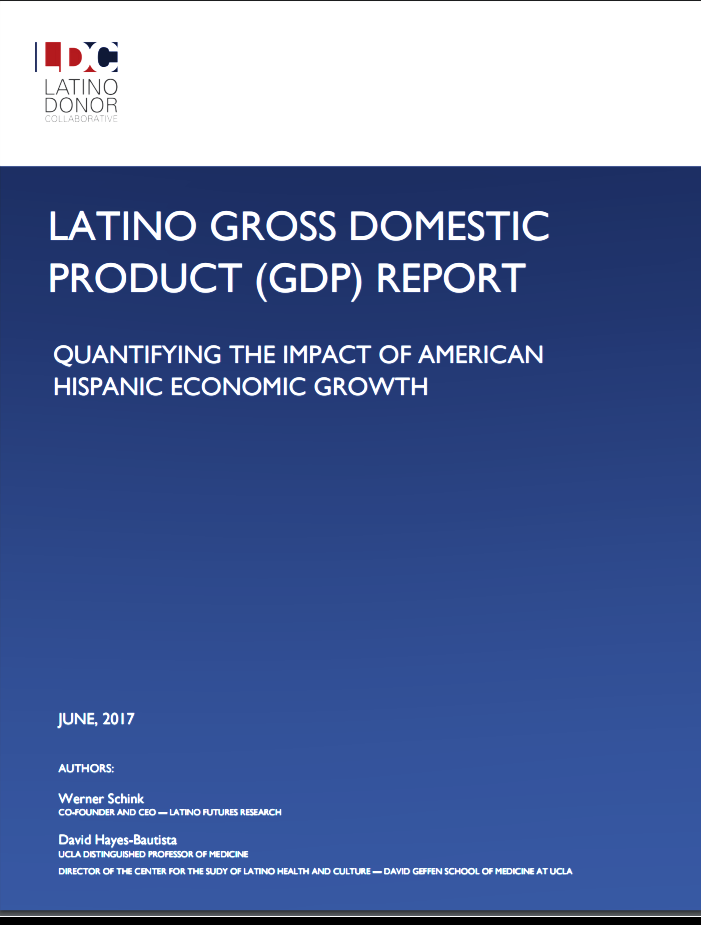
Latino Gross Domestic
Product (GDP) Report
Quantifying the Impact of
American Hispanic Economic Growth
By Werner Schink and David Hayes-Bautista
The NiLP Report (September 7, 2017)

To download the report, click here
 
To respond to questions about the nature of Latino contributions to the United States, the Latino Donor Collaborative commissioned original research, the first of its kind, which has produced the Latino Gross Domestic Product (GDP) Report. It presents a factual view of the importance of Latinos to our economy, for all Americans to understand, in business, non-profit organizations, politics, etc.
We thought that Latinos were powering in the economy, but were pleasantly surprised to discover what is actually happening: 
  • The GDP produced by Latinos in the U.S. in 2015 was $2.13 trillion.
  • If it were an independent country, the Latino GDP would be the 7th largest in the world, larger than the GDP of India, Italy, Brazil or Canada. The Latino GDP would trail only the U.S., China, Japan, Germany, the U.K., and France.
  • Of the top ten economies, it would be the third-fastest growing GDP.
  • The U.S. Latino GDP is growing 70% faster thant the country's non-Latino GDP.
  • Latinos accounted for 70% of the U.S. work force's increase in the first half of this decade.
  • As young Latinos enter the work force and the older non-Latinos leave it, the Latino GDP will account for an increasing portion of the total U.S. GDP growth, projected to be 24.4% of total US GDP growth by 2020.
The common perception of Latinos being a burden to U.S. society is utterly wrong. To the contrary, Latinos are the element most needed to fuel the growth of this country. All Americans have benefitted from the $2.13 trillion contribution the Latino GDP makes to the country, and should take steps to make sure it continues.
Werner Schink is Co-Founder and CEO, Latino Futures Research
David E. Hayes-Bautista is Distinguished Professor of Medicine, David Geffen School of Medicine at UCLA